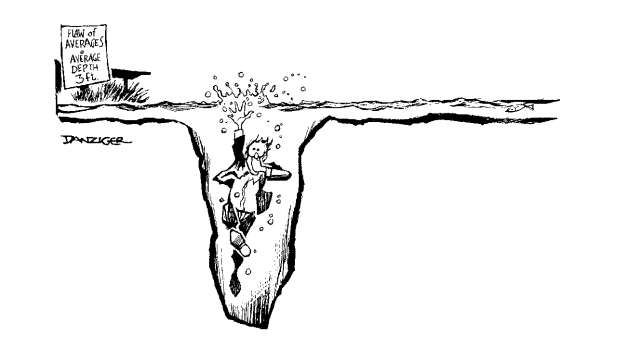
The Flaw of Averages occurs when uncertainties are replaced by single number average estimates. It states that plans based on average assumptions are wrong on average. A classic example is the case of the statistician who drowns crossing the river that is on average three feet deep. Cartoonist Jeff Danziger’s sensitive portrayal of this tragedy appears below.
The Flaw of Averages explains why so many plans are behind schedule, beyond budget, and below projection. It also applies to a wide variety of issues in climate change.
Consider a conceptual example involving coastal flooding, in which there is a 50 percent chance that sea level could go either up or down by one foot in the next 20 years. And consider a region in which a one-foot increase would result in $1 billion economic loss, while there would be no loss if there is a decrease.
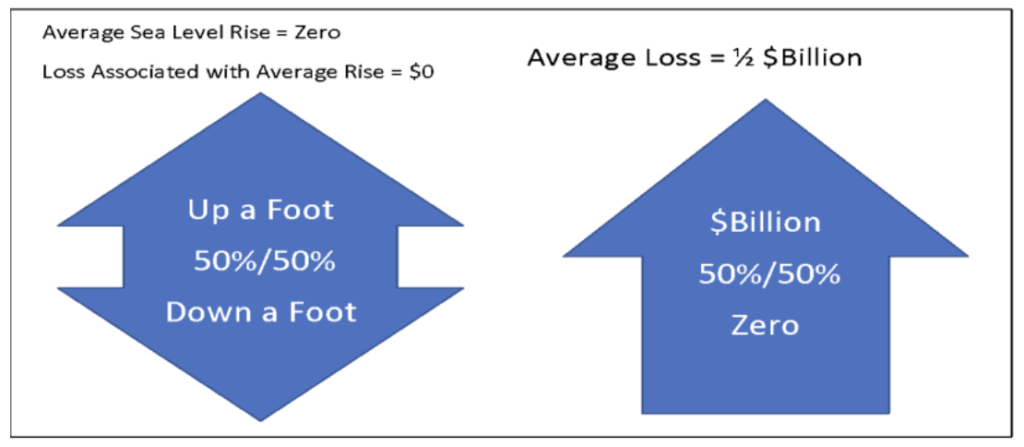
The average increase is the average of +1 foot and -1 foot, which equals zero feet. And zero feet of increase results in zero loss. But if we explicitly model the uncertainty, we see that the loss is like flipping a coin with zero on one side and negative $1 billion on the other, so the average loss is half a billion dollars. Let me say that again. The loss associated with the average sea level rise is zero, but the average loss is $500,000,000. Excuse me, but that’s not close enough even for government work! Now ask yourself if you have ever made the mistake of replacing an uncertainty with a single number best guess.
The problem is that sea level can go either up or down, while losses can only go up. This is a special case of what mathematicians call Jensen’s Inequality, and it applies to nonlinear loss relationships. But even most mathematicians don’t recognize the term, so I will stick with the Flaw of Averages.
Simulation: A Cure for the Flaw of Averages
To cure the Flaw of Averages, you have to stop using single numbers to represent uncertainties and start using a whole lot of numbers to represent all the things that might happen. This is the basis of Monte Carlo simulation, a technique developed in the 1940s during the development of the atomic bomb, when there was uncertainty about all sorts of things. I like to think of it as analogous to shaking a ladder before you climb on it to make sure that it is stable. You bombard the ladder with a bunch of random forces and determine the chances that it will fall down. Similarly, you can bombard a model of your coastal region with a bunch of potential floods and determine the chances of various levels of damage.
Long used by financial engineers and the insurance industry, Monte Carlo simulation is now available to anyone with Microsoft Excel. The downloadable Excel model shown in the image below runs 1,000 potential floods per keystroke.
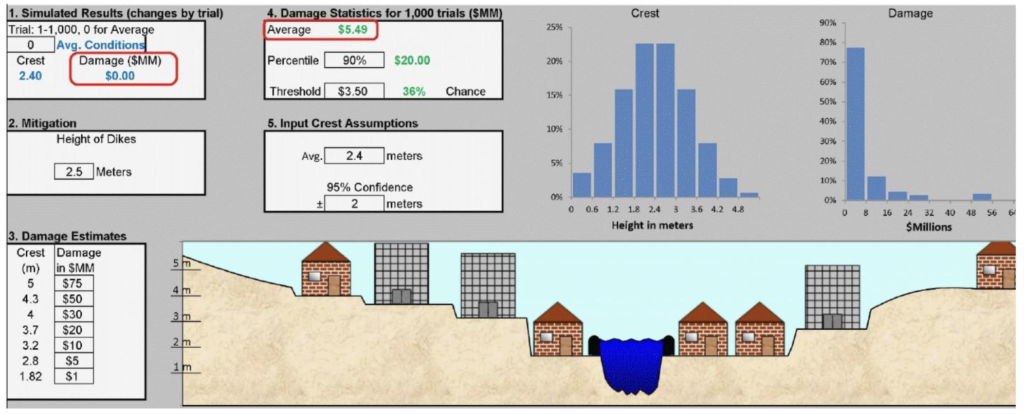
I suggest that you download the model and change the trial number in Box 1 to view several of the 1,000 possible flood outcomes. Set the Trial number to 0 for the Average flood height. Note that the damage associated with the Average flood is zero, but the Average Damage in Box 4 is $5.49 million. See how this average varies as you experiment with the height of the dikes in Box 2, and the Damage table in Box 3. Remember, every keystroke instantly runs 1,000 trials, so you can get an experiential feeling for uncertainty. This sort of interactive simulation wasn’t available at any price just a few years ago, let alone in a common spreadsheet.
Where would the data for such a model come from? First, most municipalities have elevation maps and are aware of the value of properties at various heights above sea level. So, filling out something like Box 3 is not rocket science. But how about the uncertainty in future flooding? Most sewer and water districts have access to the results of simulations that reflect the uncertainty in flooding. The problem is communicating such uncertain results in an actionable manner.
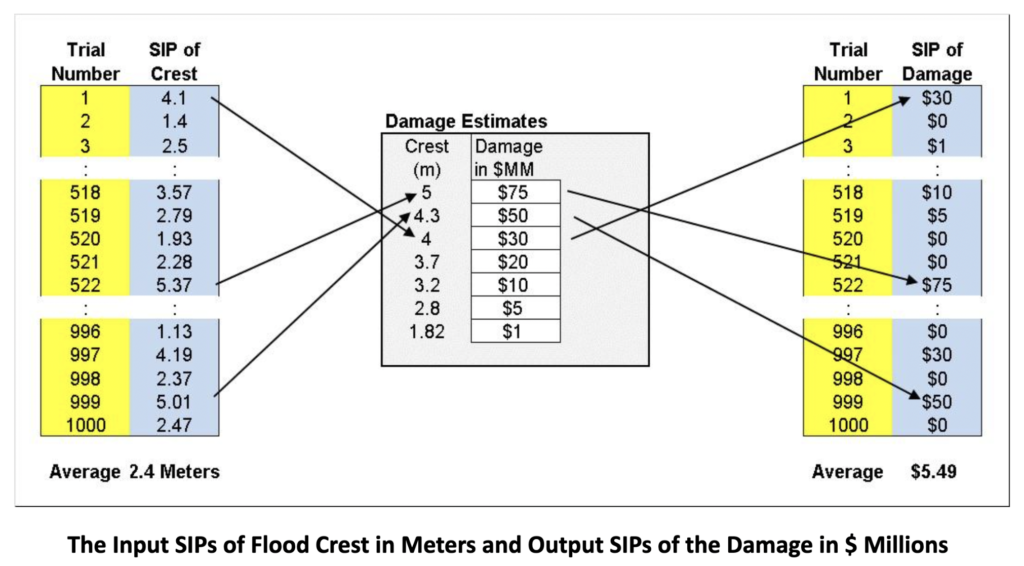
This is where 501(c)(3) ProbabilityManagement.org comes in. By creating open data standards, the nonprofit is transforming simulation from a highly technical methodology used in siloed applications, to a collaborative network for communicating and calculating uncertainties by decision makers in all fields. The idea is to represent uncertainties as arrays of thousands of potential outcomes, called Stochastic Information Packets or SIPs.
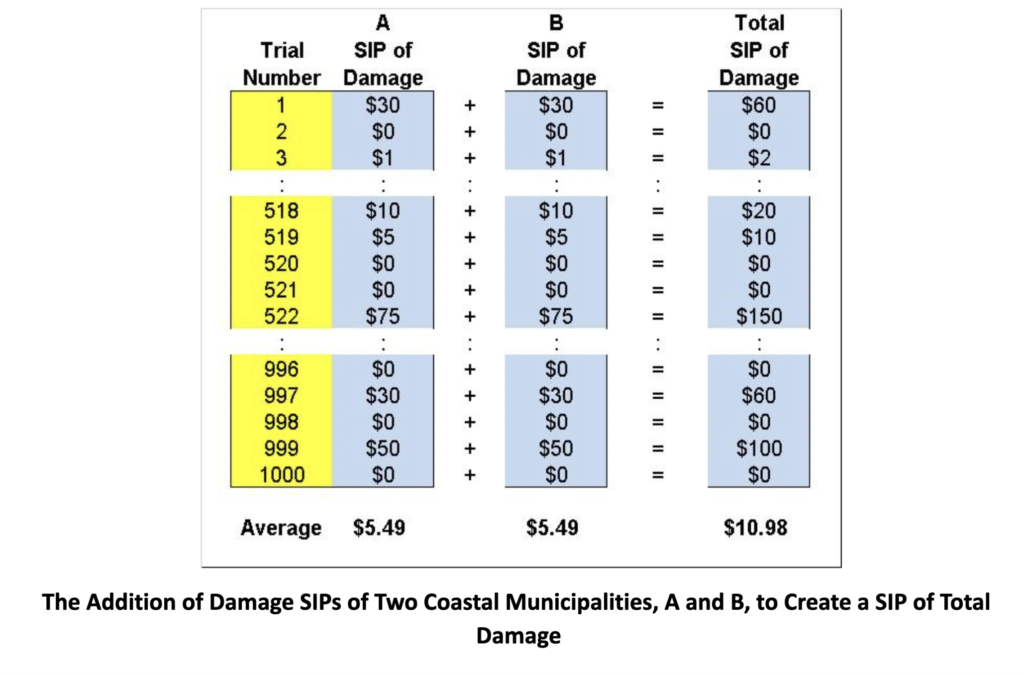
The SIPs of the flood and resulting damage model above appear below.
Risk Doesn’t Didn’t Add Up
Traditionally, the results of different simulations could not be easily aggregated. But an important property of SIPs is that they can be added together while preserving the statistical interrelationships between the uncertainties.
Consider two identical coastal municipalities, A and B, whose flooding is caused only by sea level. For simplicity, we will ignore tidal and wind effects, although these factors could be captured through local weather and hydrological models. If we wanted the SIP of total damage across both municipalities, we would simply add the Damage SIPs of each city element by element. Because sea level rise is essentially the same everywhere on earth.
Notice that the average damage across both cities is just the sum of the two averages, or $10.98 million. But when things are bad in one city, they are necessarily equally bad in the other, leading to the whopping $150 million in damage on Trial 522.
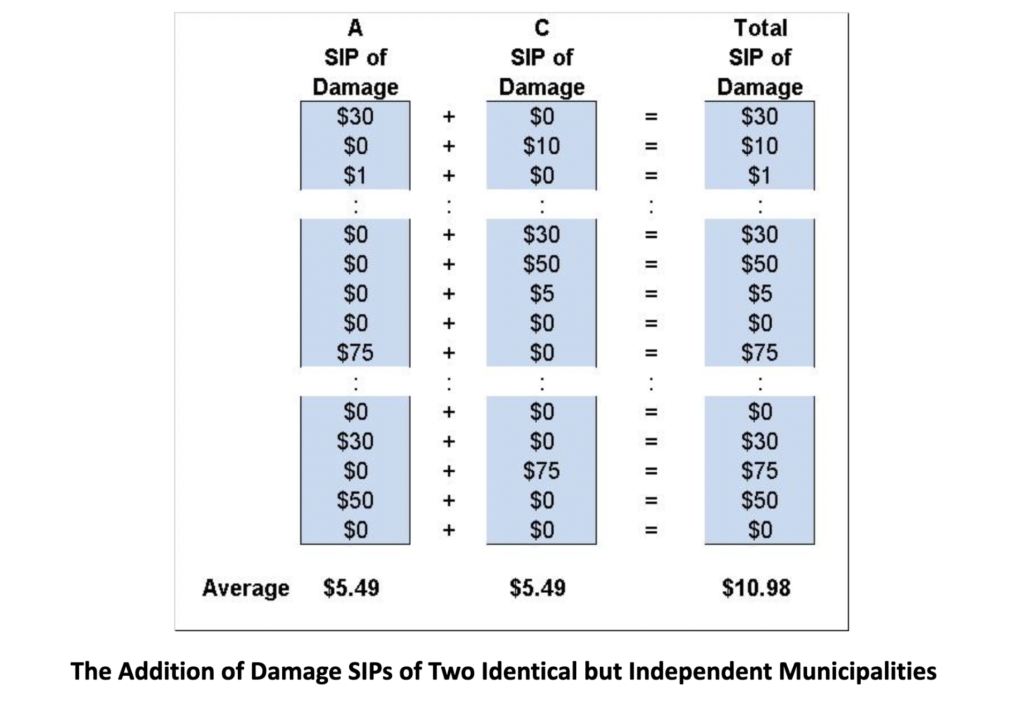
Now consider a third municipality, C, identical in every way to the other two, except that it is high in the mountains, and its flooding comes from rain-swollen rivers. The uncertainty in total damage across A and C is very different than across A and B, as shown below. Although the flooding in A and C are statistically equivalent, they are no longer in lockstep because the mountain flooding is independent of sea level rise. As shown below, the Average of total Damage is the same, but the chance of $75 million in damage occurring simultaneously in both cities is negligible.
Being able to aggregate flood damage risk in this manner is important because mitigation plans such as seawalls in one district may end up increasing flooding in another district. SIP libraries may assist municipalities in coordinating their individual plans into regional plans that are better for everyone.
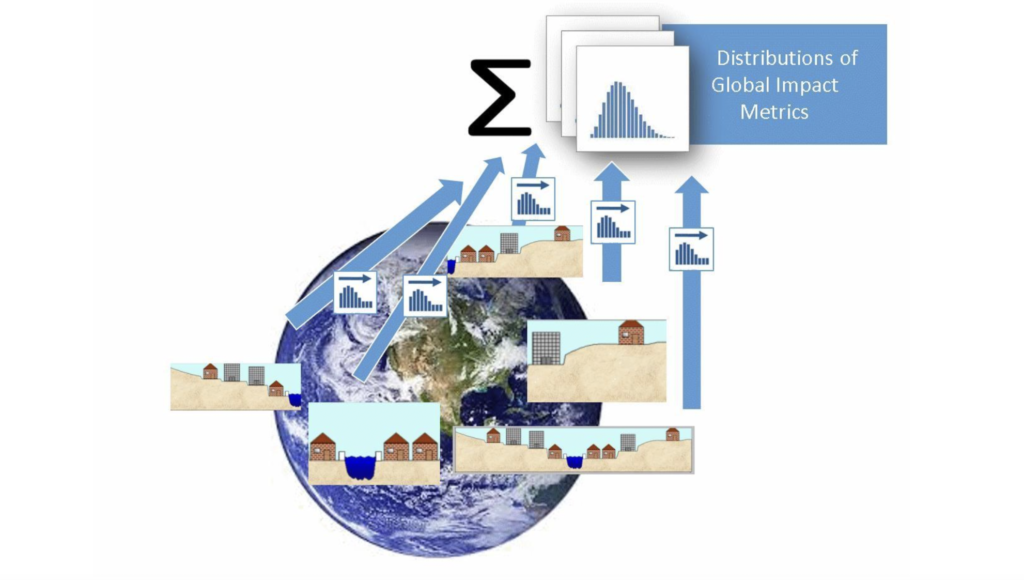
In theory, this idea can even be extended to aggregate the damage of sea level rise on a global scale. Current climate models involve huge computer simulations just to estimate future sea levels and temperatures. To take this to the next step and gauge the resulting economic impact across thousands of coastal areas would require the near-impossible task of incorporating each region’s loss model into the already overloaded climate change model. SIP Libraries offer an alternative. SIPs of important climate change factors could be stored in the cloud for use by anyone.
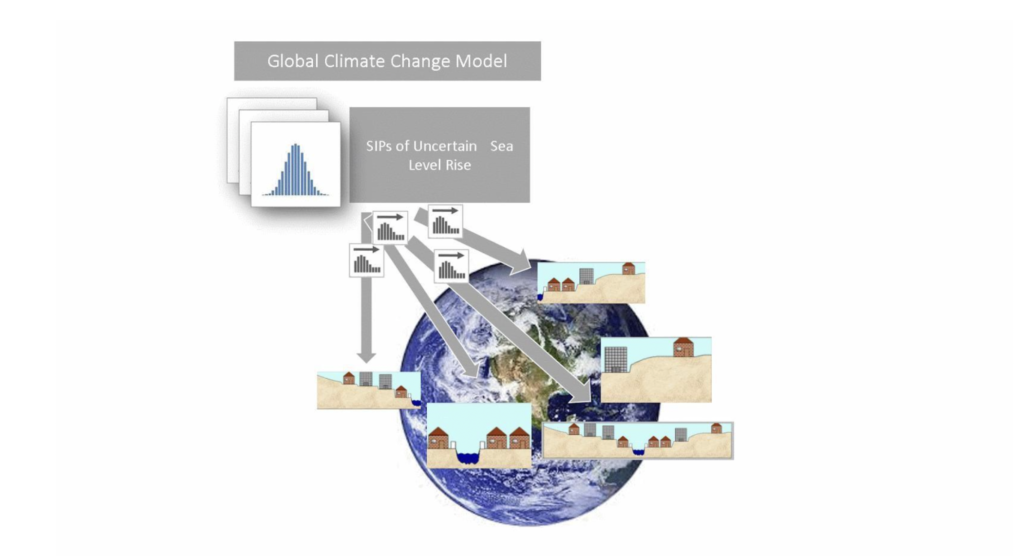
Modelers in each region can run these SIPs through local hydrology and other models.
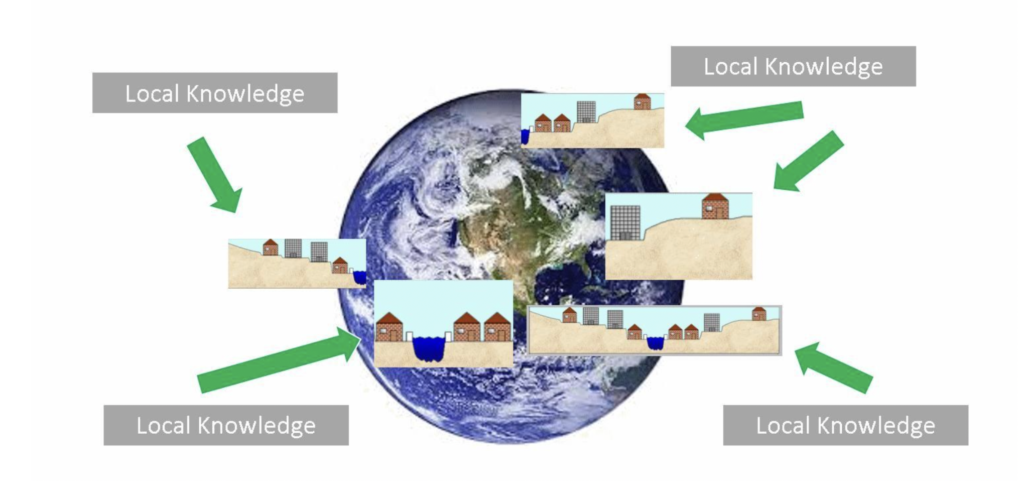
Finally, these models can export coherent SIPs that reflect the same climate conditions on each trial, which can be added together to estimate the uncertainty in global economic impact.
Conclusion
There are many capable people studying climate change and its potential mitigations. However, any discussion that does not include uncertainty will run afoul of the Flaw of Averages. Even when discussions do acknowledge uncertainty, it has been difficult to convey information as actionable data. I advocate the explicit recognition, calculation, and communication of uncertainty in climate change. Of course, real-world models would include many other factors beyond those discussed here, but they would not be beyond the scope of models already in use in finance, insurance, energy, biology, and general risk management.
DR. SAM L. SAVAGE is Executive Director of ProbabilityManagement.org, a 501(c)(3) nonprofit devoted to the communication and calculation of uncertainty. The organization has received funding from Chevron, Lockheed Martin, General Electric, PG&E, Wells Fargo and others, and Harry Markowitz, Nobel Laureate in Economics was a founding board member. Dr. Savage is author of The Flaw of Averages: Why We Underestimate Risk in the Face of Uncertainty (John Wiley & Sons, 2009, 2012), is an Adjunct Professor in Civil and Environmental Engineering at Stanford University and a Fellow of Cambridge University’s Judge Business School. He is the inventor of the Stochastic Information Packet (SIP), an auditable data array for conveying uncertainty. Dr. Savage received his Ph.D. in computational complexity from Yale University.